

Histogram
Histogram
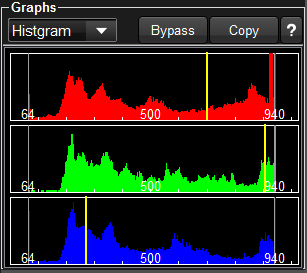
You can confirm pixels value distribution by histogram for currently viewing still image.
The place of the pixel value at mouse cursor shows yellow vertical line in the graph.
If you selected HDR in output color space, the position of 100nits, 400nits, 1000nits, 2000nits, 4000nits are shown in yellow dotted line.
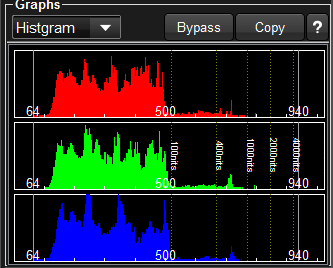
Above graph is the example of HDR_ST2084 for the output color space setting. The distribution of the pixels values are dense under 100nits but there are a few pixels between 400nits and 1000nits.
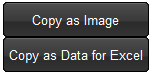
Copy button triggers the menu above. "Copy as Image" copies the graph as image data, "Copy as Data for Excel" copies the data which can be paste to Excel.
Here is the example of copied data.
SONY PMW-F55_SLog3_Custom(Gamut3Like)_Tungsten_DeSat 0.26_HDR 4000nits_RRT V1.0_None_1.00 |
|||
F55_Slog3Sgamut3_DL.dpx |
|||
0 |
0 |
0 |
0 |
4 |
0 |
0 |
0 |
8 |
0 |
0 |
0 |
12 |
0 |
0 |
0 |
16 |
0 |
0 |
0 |
20 |
0 |
0 |
0 |
24 |
0 |
0 |
0 |
28 |
0 |
0 |
0 |
32 |
0 |
0 |
0 |
36 |
0 |
0 |
0 |
40 |
0 |
0 |
0 |
44 |
0 |
0 |
0 |
48 |
0 |
0 |
0 |
52 |
0 |
0 |
0 |
56 |
0 |
0 |
0 |
60 |
0 |
0 |
0 |
64 |
298 |
7 |
626 |
68 |
114 |
0 |
22 |
72 |
25 |
1 |
10 |
76 |
29 |
1 |
10 |
80 |
15 |
1 |
7 |
84 |
9 |
1 |
14 |
88 |
19 |
0 |
27 |
92 |
17 |
0 |
14 |
96 |
7 |
1 |
23 |