Wave Form Graph
Wave Form Graph
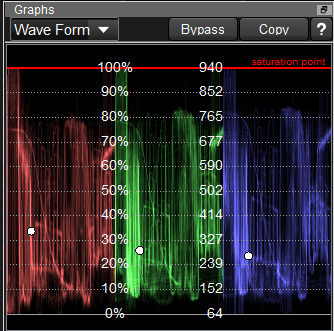
You can confirm pixels value distribution by histogram for currently viewing still image.

White circle shows the pixcel value position of the mouse cursor position or selected area average on the image.
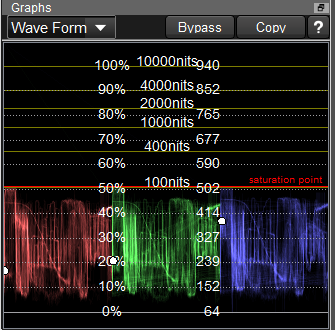
Red line is the maximum value which can be created on the current setting. (saturation point)
On the above example, there is a red line around 100%, and it means you can saturate colors for white.
For example, if you set HDR in ODT setting, but rendering target is still Rec709, the saturation point remains around 100% like the graph below.

On this case, color pipline is below.

You can confirm the rendering target is still Rec709.
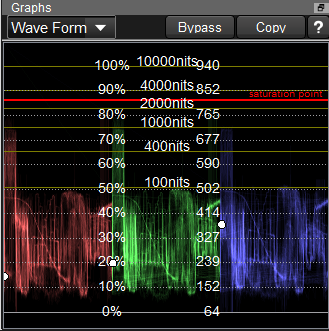
If you change the rendering target to 4000nits, you can get following graph.

The saturation point red line rise up to about 3000nits and you can use above 100nits HDR brightness.
As you can see, when targeting HDR, it is very important to confirm the shape of the wave form and check the level of saturation point's red line to avoid the mistake.

