

IDT
Camera Profile : IDT(Input Device Transform)
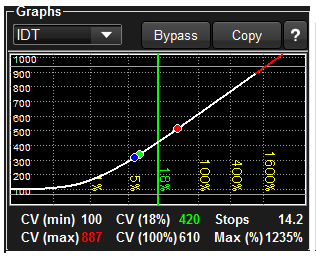
This graph shows the result of camera's tone curve measurement. Holizontal is log scale exposure, vertical is 10bit output. Increasing white curve shows the characteristic of camera's response. The red curve at the highlight regeon is outside of camera's capability, the camera can not output these values even given extreme bright scene. The red, green blue circles shows the position of the pixel value where the mouse cursor on the still image.
The below of the graph lies the table which express camera characteristics in number. CV means code value in 10bit (0-1023) scale. Stops, Max are relate to dynamic range but these values contains errors because of automatical calcuration.

Copy button triggers the menu above. "Copy as Image" copies the graph as image data, "Copy as Data for Excel" copies the data which can be paste to Excel.
Here is the example of copied data.
-------------------------------------------------------------------------------------------------------------------------
SONY PMW-F55_SLog3_SGamut3_Tungsten_DeSat1_Rec709_RRT V1.0_None_1.00 |
||||||||
[SONY][PMW-F55][SLog3_SGamut3_TN_DeSat1][rev2.0]_ImageView_N.jpg |
||||||||
CVmin |
100 |
CVmax |
887 |
|||||
LogEmax |
-3.2 |
LogEMin |
1.1 |
|||||
DRange |
4.3 |
Stops |
14.2 |
Maxmum White(%) |
1235 |
|||
DeltaE |
0 |
|||||||
Matrix |
||||||||
0.73579 |
0.04642 |
0.01157 |
||||||
0.15492 |
0.95695 |
-0.00005 |
||||||
0.1093 |
-0.00336 |
0.98848 |
||||||
Tone Curve |
||||||||
CV |
ACES Linear |
index |
ACES Linear |
LogACES |
OCV |
measuredOCV |
||
0 |
-0.01402 |
0 |
0.000316 |
-3.5 |
97.1444 |
97.1444 |
||
1 |
-0.01387 |
1 |
0.00032 |
-3.49462 |
97.171 |
97.171 |
||
2 |
-0.01371 |
2 |
0.000324 |
-3.48925 |
97.198 |
97.198 |
||
3 |
-0.01356 |
3 |
0.000328 |
-3.48387 |
97.2252 |
97.2252 |
||
4 |
-0.0134 |
4 |
0.000332 |
-3.47849 |
97.2528 |
97.2528 |
||
5 |
-0.01325 |
5 |
0.000336 |
-3.47312 |
97.2808 |
97.2808 |
||
6 |
-0.0131 |
6 |
0.000341 |
-3.46774 |
97.3091 |
97.3091 |
||
7 |
-0.01295 |
7 |
0.000345 |
-3.46237 |
97.3377 |
97.3377 |
||
8 |
-0.01279 |
8 |
0.000349 |
-3.45699 |
97.3667 |
97.3667 |
||
9 |
-0.01264 |
9 |
0.000353 |
-3.45161 |
97.396 |
97.396 |
||
10 |
-0.01249 |
10 |
0.000358 |
-3.44624 |
97.4257 |
97.4257 |
||
11 |
-0.01234 |
11 |
0.000362 |
-3.44086 |
97.4558 |
97.4558 |
||
12 |
-0.01219 |
12 |
0.000367 |
-3.43548 |
97.4862 |
97.4862 |
||
13 |
-0.01204 |
13 |
0.000371 |
-3.43011 |
97.517 |
97.517 |
||
14 |
-0.01189 |
14 |
0.000376 |
-3.42473 |
97.5482 |
97.5482 |
||
15 |
-0.01175 |
15 |
0.000381 |
-3.41935 |
97.58 |
97.58 |
||
16 |
-0.0116 |
16 |
0.000385 |
-3.41398 |
97.6123 |
97.6123 |
||
17 |
-0.01145 |
17 |
0.00039 |
-3.4086 |
97.645 |
97.645 |
||
18 |
-0.0113 |
18 |
0.000395 |
-3.40323 |
97.6781 |
97.6781 |
||
19 |
-0.01116 |
19 |
0.0004 |
-3.39785 |
97.7115 |
97.7115 |
||
20 |
-0.01101 |
20 |
0.000405 |
-3.39247 |
97.7454 |
97.7454 |
||
21 |
-0.01087 |
21 |
0.00041 |
-3.3871 |
97.7798 |
97.7798 |
||
22 |
-0.01072 |
22 |
0.000415 |
-3.38172 |
97.8145 |
97.8145 |
||
23 |
-0.01058 |
23 |
0.00042 |
-3.37634 |
97.8497 |
97.8497 |
||