

Saturation / Hue Curve
Saturation/Hue Curve Control
You can control Saturation and Hue by designing the curve depending on the brightness. The target color can be selected from all, red,green,blue,cyan,magenta and yellow.
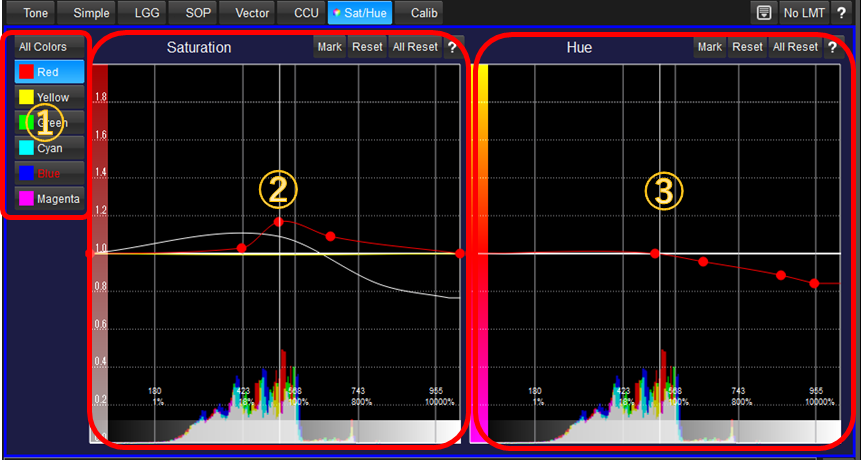
①Selection of Target Color
You can select the target color for Saturation/Hue control here. "All Colors" are targeting all of the colors regardless of the hue. If you want to target specific color only, please select from color patched buttons. When you move the cursor on the image, or select the area on the image, the target color will be shown in red character.
②Saturation Control
You can control saturation here. Horizontal axis is brightness in grading space unit. The target color will be decided by the maximum value from R,G and B, not Y component of YCC.
Vertical axis is the saturation parameter. Center is 1.0 as default, minimum value is 0.0 and maximum value is 2.0. As the same manner with Tone Curve control, you can create the point by clicking on the curve, move the point by dragging, to create specific saturation parameter curve depending on the brightness. You can use upto 16 points.
There is a histogram on the bottom of the graph. The histogram is the distribution of the pixel values in grading space. You can confirm the population of the pixels on the horizontal axis. This histogram do not contain Looks you created. So it will not change even if you change the color correction. If you move the mouse cursor on the image, or select the area on the image, the vertical white bar will be shown on the graph. It represents the horizontal value of the selected image area so that you can adjust the specific point the selected color could be controlled.
③Hue Control
You can control hue here. Horizontal axis is the same as Saturation Control, brightness in grading space unit. The target color will be decided by the maximum value from R,G and B, not Y component of YCC.
Vertical axis is the hue variation angle value. Center is 0.0 as default, minimum value is equivalent to -60 degree, and maximum value is 50 degree, which is the adjacent color. As the same as Saturation Control, you can create the point by clicking on the curve, move the point by dragging, to create specific hue parameter curve depending on the brightness. If you selected "All Colors", the hue of all color will rotate. Please be careful.
As the same as Saturation Control, there is a histogram on the bottom of the graph, and the vertical white bar on the graph which means the position of currently selected color on the image.
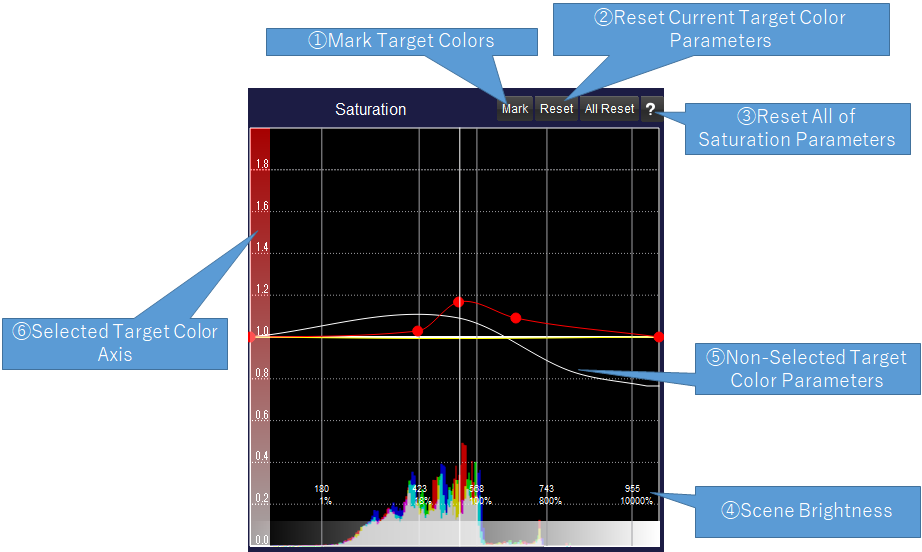
More detailed explanation of Saturation Control
Number + Title |
Explanation |
①Mark Button |
Show the pixels which is targeted by current selection in green color. It is valid only pushing down the button. It will affect not only the image on screen, but the output of LUTBOX devices. |
②Reset Current Setting |
Reset the parameters of current target color only. |
③Reset All |
Reset all of the parameters of Saturation Control. |
④Scene Brightness notation |
It shows scene brightness values in % unit. |
⑤Non selected parameter curve |
The parameter curve which is not selected at this moment will be shown in respective color curves without points in circle. |
⑥Target Color Axis |
Axis is shown in selected color saturation ramp. |